virus evolution in humans


Epitope substitutions are based on HA structure and exposed residues. Multiple recent mutations at epitope sites have been suggested to be predictive for strains dominating future seasons.

Mutations outside of the epitopes (see above) -- termed non-epitope sites --- tend to be damaging and are suggested to be predictive of clade contraction.

Antigenic evolution has been shown to depend primarily on substitutions surrounding the receptor binding site of HA1. These seven positions (145, 155, 156, 158, 159, 189, 193 in HA1 numbering) are referred to here as receptor binding positions and changes at these positions could correspond to large changes in antigenic properties.

The local branching index is the exponentially weighted tree length surrounding a node, which is associated with rapid branching and expansion of clades. A more detailed explanation is available here. Retrospective analysis has shown that LBI correlates with clade growth. For coloring, the LBI is normalized to the interval 0-1.


Use the input box to specify positions to color viruses by genotype. Amino acid positions must be separated by a comma (e.g. 159,225). Only positions at which at least 10 strains have mutations are included.

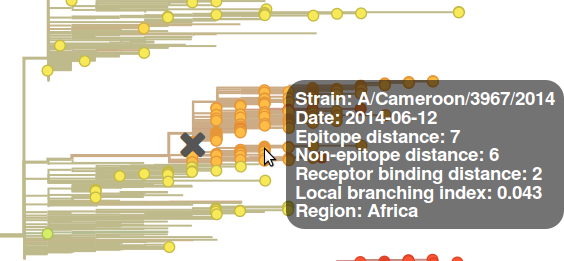
Placing the mouse over a circle corresponding to a virus strain displays the name, sampling date, and the numerical values of the different features.
Placing the mouse a branch ancestral to a clade will display the frequency at the date specified by the date slider. For large clades, the frequency trajectory will be shown in the "mutation and genotype frequencies" plot as the curve labeled "clade".

